Years ended March 31
| ¥ billions | % | US$ billions1 | |||
| 2013 | 2014 | 2015 | YoY Change | 2015 | |
| Policy Results2 | |||||
| Policy basis | |||||
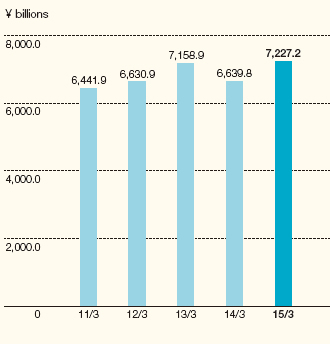
| New policy amount | ¥7,158.9 | ¥6,639.8 | ¥7,227.2 | 8.8 | $60.1 |
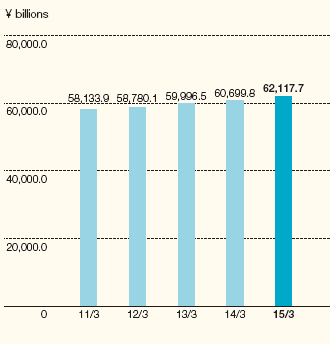
| Policy amount in force | 59,996.5 | 60,699.8 | 62,117.7 | 2.3 | 516.9 |
| Surrender and lapse amount | 4,071.3 | 3,967.4 | 3,752.4 | (5.4) | 31.2 |
| Annualized premium basis | |||||
| Annualized premiums of new policies | ¥164.2 | ¥127.9 | ¥161.3 | 26.1 | $1.3 |
| Third sector products | 15.6 | 16.5 | 20.8 | 25.6 | 0.1 |
| Annualized premiums of total policies | 1,447.7 | 1,420.5 | 1,446.4 | 1.8 | 12.0 |
| Third sector products | 160.9 | 163.4 | 169.8 | 4.0 | 1.4 |
| Statements of Operations Data | |||||
| Ordinary revenues | ¥2,418.9 | ¥2,085.7 | ¥2,412.1 | 15.7 | $20.0 |
| Income from insurance premiums | 1,940.9 | 1,609.7 | 1,958.0 | 21.6 | 16.2 |
| Core profit | 182.4 | 210.2 | 182.7 | (13.1) | 1.5 |
| Ordinary profit | 151.6 | 186.2 | 188.9 | 1.5 | 1.5 |
| Net income | 63.7 | 78.9 | 94.2 | 19.3 | 0.7 |
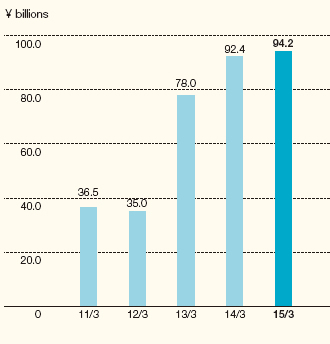
| Adjusted net income | 78.0 | 92.4 | 94.2 | 1.9 | 0.7 |
| Soundness | |||||
| Consolidated solvency margin ratio | 943.8% | 1,115.0% | 1,220.7% | 105.7pt | - |
| Shareholder Returns3 | |||||
| Dividends per share (¥, US$) | ¥22.5 | ¥25.0 | ¥25.0 | - | $0.20 |
| Share buybacks | approx. 3.0 | approx. 10.0 | approx. 30.0 | approx. 20.0 | approx. 0.24 |
| Total return to shareholders | approx. 18.1 | approx. 26.8 | approx. 46.6 | approx. 19.8 | approx. 0.38 |
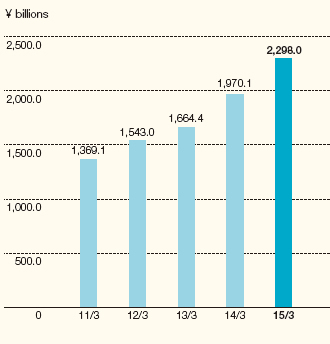
| Embedded Value (EV)4 | |||||
| Embedded value | ¥1,664.4 | ¥1,970.1 | ¥2,298.0 | 327.8 | $19.1 |
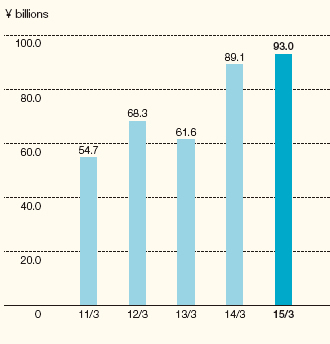
| Value of new business | 61.6 | 89.1 | 93.0 | 3.8 | 0.7 |
| Stock Price Information (Fiscal year-end) | |||||
| Stock price (¥, US$) | ¥1,136 | ¥1,227 | ¥1,654.5 | 34.8 | $13.76 |
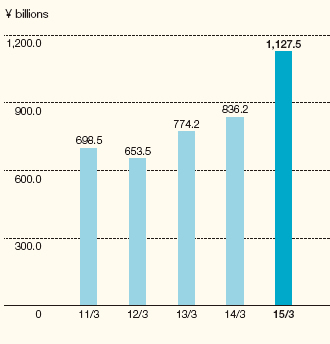
| Market capitalization | 774.2 | 836.2 | 1,127.5 | 34.8 | 9.38 |
| Social/Environmental Data | |||||
| Number of employees5 | 19,455 | 18,806 | 18,319 | (2.6) | |
| Male | 3,991 | 3,852 | 3,702 | (3.9) | |
| Female | 15,464 | 14,954 | 14,617 | (2.3) | |
| Electricity consumption (MWh=1,000 kWh) | 106,440 | 99,302 | 95,866 | (3.5) | |
| Office paper consumption (t) | 162 | 163 | 160 | (1.8) | |
| Green purchasing ratio (%) | 95.7 | 95.4 | 96.0 | 0.6 | |
- Notes
-
- For convenience only, U.S. dollar figures have been calculated at the rate of U.S.$1 = ¥120.17.
- The total of individual insurance and individual annuities, as well as J-type and T-type product. The new policy amount includes net increase from conversions.
- The Company conducted a 2 for 1 stock split on October 1, 2011.
- Calculated based on EEV for March 31, 2011, and Group MCEV from March 31, 2012 on.
- Figures are the simple sum of the non-consolidated financial data for Taiyo Life, Daido Life, and T&D Financial Life.
New Policy Amount
Policy Amount in Force
Adjusted Net Income
EV
Value of New Business
Market Capitalization