Financial Soundness
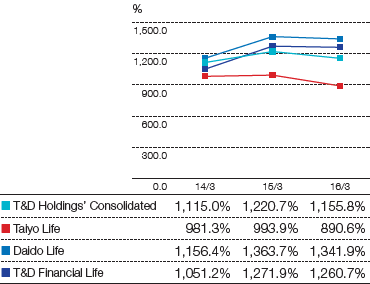
The solvency margin ratios in fiscal 2015 were 890.6% at Taiyo Life, 1,341.9% at Daido Life, and 1,260.7% at T&D Financial Life. Thus, the three life insurance companies have sufficient financial soundness.
In order to further reinforce financial soundness in preparation for further strengthening of regulations that are expected going forward, we will continue to accumulate internal reserves. Forecasts for fiscal 2016 include an additional provision in excess of the legal standard requirements for the reserve for price fluctuations of ¥8.0 billion planned by Daido Life and ¥15.0 billion planned by Taiyo Life.
Returns to Shareholders
In deciding the payout ratio, T&D Holdings, Inc. first takes into consideration maintaining sufficient equity capital to ensure the financial soundness of its three life insurance companies. The Company aims to return profits to shareholders based on a total return to shareholders ratio of 40% or more of adjusted net income, which is net income plus additional internal reserves in excess of legal requirements related to reserves for contingency and price fluctuations, after taxes.
In fiscal 2015, the Company provided a total return to shareholders of ¥33.4 billion, comprising a cash dividend of ¥30 per share, an increase of ¥5 from the previous fiscal year, and a share buyback of around 13.5 million shares at a total cost of approximately ¥14.0 billion. From fiscal 2016, the Company has decided to implement interim dividends, in order to increase opportunities to return profits to shareholders.
The Company also plans to pay a dividend of ¥30 per share for fiscal 2016, including an interim dividend of ¥15.
Solvency Margin Ratio

Return to Shareholders and Adjusted Net Income
| 14/3 | 15/3 | 16/3 | |
| Total return to shareholders (¥ billions) | approx. 26.8 | approx. 46.6 | approx. 33.4 |
| Total dividends (¥ billions) | 16.8 | 16.6 | 19.4 |
| Dividends per share (¥) | <¥25.00> | <¥25.00> | <¥30.00> |
| Share buybacks (¥ billions) | approx. 10*1 | approx. 30*2 | approx. 14*3 |
| Adjusted net income (¥ billions) | 92.4 | 94.2 | 83.3 |
| Profit attributable to owners of parent (¥ billions) | 78.9 | 94.2 | 72.5 |
| Excess amount of reserve for contingency and price fluctuations, after taxes (¥ billions) | 13.5 | - | 10.8 |
- *1 The Company conducted a share buyback from May to June 2014 as a shareholders' return for the FY2013 earnings.
- *2 The Company conducted a share buyback from May to July 2015 as a shareholders' return for the FY2014 earnings.
- *3 The Company conducted a share buyback from May to June 2016 as a shareholders' return for the FY2015 earnings.
