In fiscal 2014, the year ended March 31, 2015, T&D Holdings, Inc. (the “Company”) returned profits to shareholders through a combination of stable cash dividends and flexible share buybacks.
The Company maintained cash dividends at ¥25 per share, issuing total dividends of approximately ¥16.6 billion. However, the Company conducted share buybacks at a total cost of approximately ¥30.0 billion, roughly three times greater than the amount in the previous fiscal year.
As a result, in fiscal 2014 the Company provided a total return to shareholders of approximately ¥46.6 billion from adjusted net income of ¥94.2 billion. The total return to shareholders ratio for fiscal 2014 was approximately 50%, compared with a three-year average of around 35%.
Return to Shareholders
| 13/3 | 14/3 | 15/3 | Total return to shareholders ratio (Average over the past three years) |
|
|---|---|---|---|---|
| Dividends per share (¥) | 22.50 | 22.50 | 25.00 | - |
| Cash dividends (¥ billions) | 15.1 | 16.8 | 16.6 | - |
| Share buybacks (¥ billions) |
Approx. 3.0*1 | Approx. 10.0*2 | Approx. 30.0*3 | - |
| Total return to shareholders (¥ billions) | Approx. 18.1 | Approx. 26.8 | Approx. 46.6 | - |
| Adjusted net income (¥ billions) |
78.0 | 92.4 | 94.2 | - |
| Total return to shareholders ratio | 23% | 29% | 49% | 35% |
- *1 The Company conducted a share buyback in May 2013 as a shareholders' return for the FY2012 earnings.
- *2 The Company conducted a share buyback from May to June 2014 as a shareholders' return for the FY2013 earnings.
- *3 The Company conducted a share buyback from May to July 2015 as a shareholders' return for the FY2014 earnings.
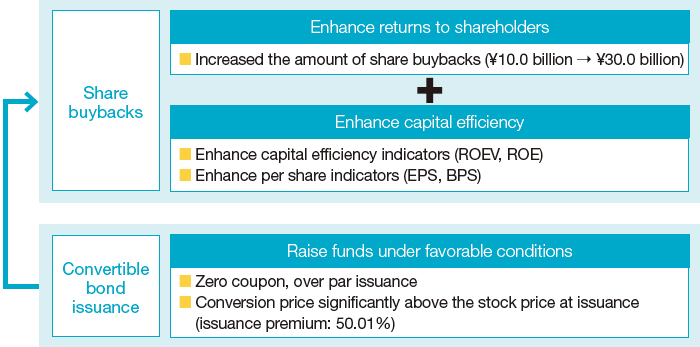
Use of Convertible Bonds
The Company raised the funds needed to conduct the share buybacks by issuing convertible bonds under favorable financing conditions. The entire amount of funds raised (¥30.0 billion) was allocated to the share buybacks.