Financial Soundness
Solvency Margin Ratio
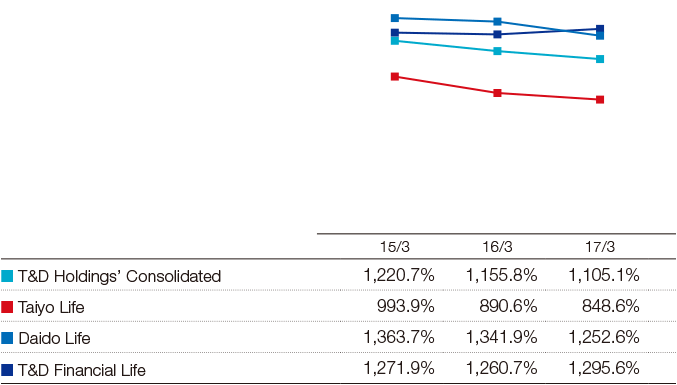
The solvency margin ratios in fiscal 2016 were 1,105.1% for T&D Holdings on a consolidated basis, 848.6% at Taiyo Life, 1,252.6% at Daido Life, and 1,295.6% at T&D Financial Life, indicating sufficient financial soundness.
ESR
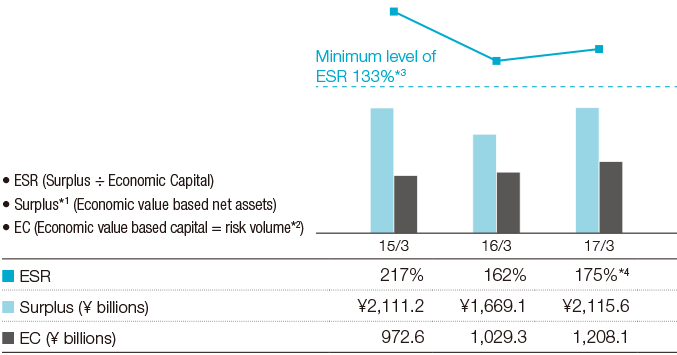
The economic solvency ratio, which represents economic value based capital adequacy, increased by 13 percentage points from the previous fiscal year-end to 175%.
The main reason for this increase was an increase in the surplus, which represents economic value based net assets, due to new sales of insurance policies, improvement in insurance assumptions, and the rise in domestic interest rates. This was despite an increase in the amount of asset management risk, primarily reflecting the rise in domestic interest rates.


- *1 The difference between assets and liabilities evaluated based on economic value. The evaluation of both assets and liabilities is calculated basically based on the same assumptions of MCEV. The cost of capital for risk margin has been set at 5% from the end of March 2017. It has been set referring to the Insurance Capital Standard (ICS) which the International Association of Insurance Supervisors (IAIS) is considering. The cost of capital for risk margin had been set at 6% on and before the end of March 2016.
- *2 Risk volume represents the economic value based risk volume, calculated using an internal model (99.5% VaR, 1-year) after diversification effects. Required capital for MCEV is calculated using the same internal model.
- *3 Represents the capital level needed to cover a risk amount with VaR 99.93% assuming the current risk profile.
- *4 ESR as of the end of March 2017 applying UFR was approximately 192%.


