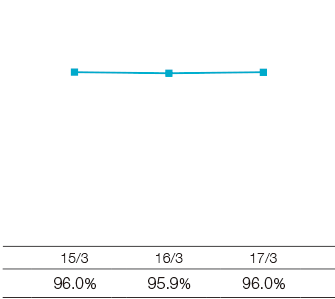
Social/Environmental Data
The T&D Life Group has been promoting to nurture a corporate culture where diverse human resources can feel job satisfaction and reach their potential.
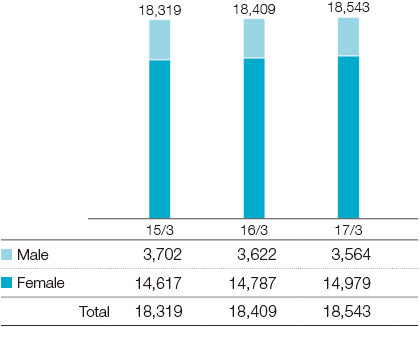
Number of Employees*1
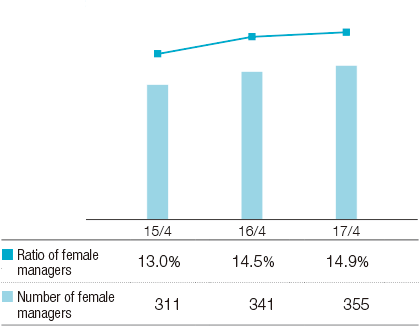
Ratio/Number of Female Managers*1, 2
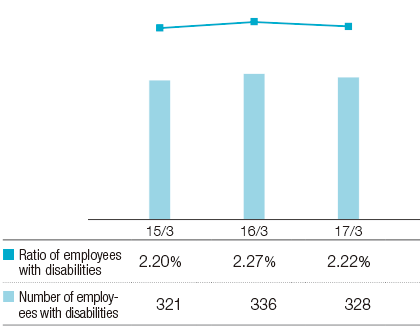
Ratio/Number of Employees with Disabilities*1
- *1 The data is the sum of the three insurance companies.
- *2 The data is as of April 1, in the month following the fiscal year-end.
In cooperation with Group companies, the T&D Life Group has set Group-wide targets related to environmental protection, and is working to achieve these targets in the course of its daily business activities.
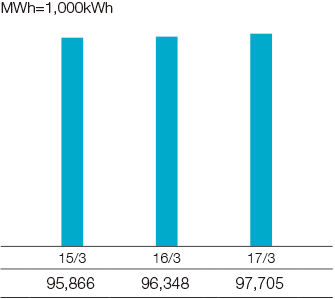
Electricity Consumption
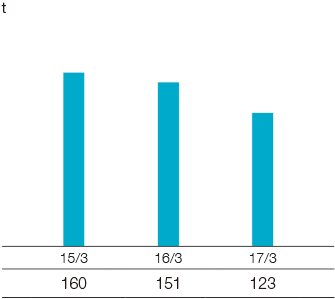
Office Paper Consumption
Green Purchasing Ratio
