


Shareholder Return Policy
T&D Holdings's shareholder return policy is to realize stable and sustainable shareholder returns.
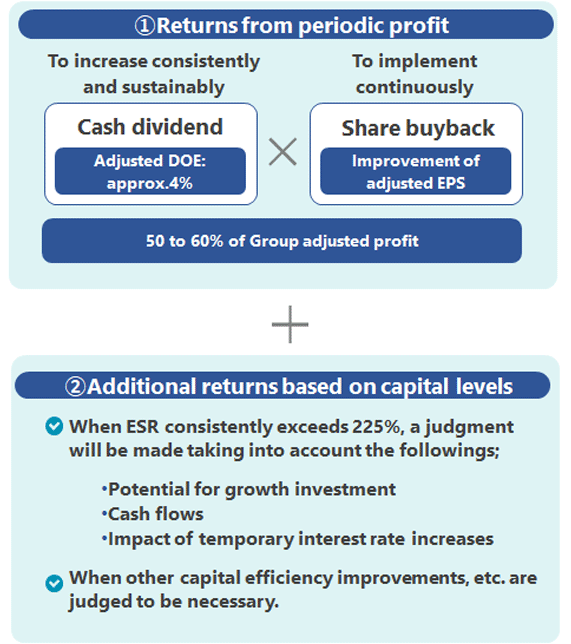
①Returns from periodic profit
●We will implement a cash dividend with a payout ratio of 60% based on the 5-year average of Group adjusted profit.
②Additional returns based on capital levels
●When ESR consistently exceeds 225%, a judgment will be made taking into account.
Potential for growth investment / Cash flows
●When other capital efficiency improvements, etc. are judged to be necessary.
Historical Dividends
| Dividend per Share | Total dividend | |||
|---|---|---|---|---|
| Interim | Year-end | Annual(Total) | ||
| FY ended March 31, 2027 | ¥82(Forecast) | ¥82(Forecast) | ¥164(Forecast) | ¥79.1 billion(Forecast) |
| FY ended March 31, 2026 | ¥62 | ¥68(Planned) | ¥130(Planned) | ¥63.6 billion(Planned) |
| FY ended March 31, 2025 | ¥40 | ¥40 | ¥80 | ¥41.5 billion |
| FY ended March 31, 2024 | ¥35 | ¥35 | ¥70 | ¥37.4 billion |
| FY ended March 31, 2023 | ¥31 | ¥31 | ¥62 | ¥34.3 billion |
| FY ended March 31, 2022 | ¥28 | ¥28 | ¥56 | ¥32.1 billion |
| FY ended March 31, 2021 | ¥22 | ¥24 | ¥46 | ¥27.4 billion |
| FY ended March 31, 2020 | ¥22 | ¥22 | ¥44 | ¥26.4 billion |
| FY ended March 31, 2019 | ¥20 | ¥22 | ¥42 | ¥25.7 billion |
| FY ended March 31, 2018 | ¥17.5 | ¥20 | ¥37.5 | ¥23.3 billion |
| FY ended March 31, 2017 | ¥15 | ¥17.5 | ¥32.5 | ¥20.5 billion |
| FY ended March 31, 2016 | - | ¥30 | ¥30 | ¥19.4 billion |
| FY ended March 31, 2015 | - | ¥25 | ¥25 | ¥16.6 billion |
| FY ended March 31, 2014 | - | ¥25 | ¥25 | ¥16.8 billion |
| FY ended March 31, 2013 | - | ¥22.5 | ¥22.5 | ¥15.1 billion |
| FY ended March 31, 2012 | - | ¥22.5 | ¥22.5 | ¥15.1 billion |
| FY ended March 31, 2011 | - | ¥45 | ¥45 | ¥15.3 billion |
| FY ended March 31, 2010 | - | ¥45 | ¥45 | ¥15.3 billion |
| FY ended March 31, 2009 | - | ¥45 | ¥45 | ¥12.3 billion |
| FY ended March 31, 2008 | - | ¥65 | ¥65 | ¥16 billion |
| FY ended March 31, 2007 | - | ¥65 | ¥65 | ¥16 billion |
| FY ended March 31, 2006 | - | ¥55 | ¥55 | ¥13.5 billion |
*
T&D Holdings conducted a 2 for 1 stock split on October 1, 2011.
Please see "TANSHIN Reports" page for the projected dividend.
Share Buybacks
| Total amount of acquisition | Acquisition time | |
|---|---|---|
| FY ended March 31, 2025 | About ¥100 billion | From May 2025 to March 2026 |
| FY ended March 31, 2024 | About ¥50 billion | From May 2024 to April 2025 |
| FY ended March 31, 2023 | About ¥40 billion | From May 2023 to February 2024 |
| About ¥20 billion | From November 2022 to March 2023 | |
| FY ended March 31, 2022 | About ¥40 billion | From November 2021 to May 2022 |
| FY ended March 31, 2021 | About ¥10 billion | From May to June 2021 |
| FY ended March 31, 2020 | About ¥13 billion | From November to December 2020 |
| FY ended March 31, 2019 | About ¥13 billion | From May to June 2019 |
| FY ended March 31, 2018 | About ¥17 billion | From May to June 2018 |
| FY ended March 31, 2017 | About ¥17 billion | From May to June 2017 |
| FY ended March 31, 2016 | About ¥5 billion | In February 2017 |
| About ¥14 billion | From May to June 2016 | |
| FY ended March 31, 2015 | About ¥30 billion | From May to July 2015 |
| FY ended March 31, 2014 | About ¥10 billion | From May to June 2014 |
| FY ended March 31, 2013 | About ¥3 billion | In May 2013 |
| FY ended March 31, 2012 | About ¥5 billion | From November to December 2011 |
Stockholder Benefit Program
Not Implemented.