






Shareholder Return Policy
Our basic policy on shareholder returns is to enhance shareholder value while maintaining the financial soundness of the Company and its group companies, and to provide stable profit distributions after securing the internal reserves necessary for the Group’s business operations and growth.
Our specific shareholder return policy is as follows:
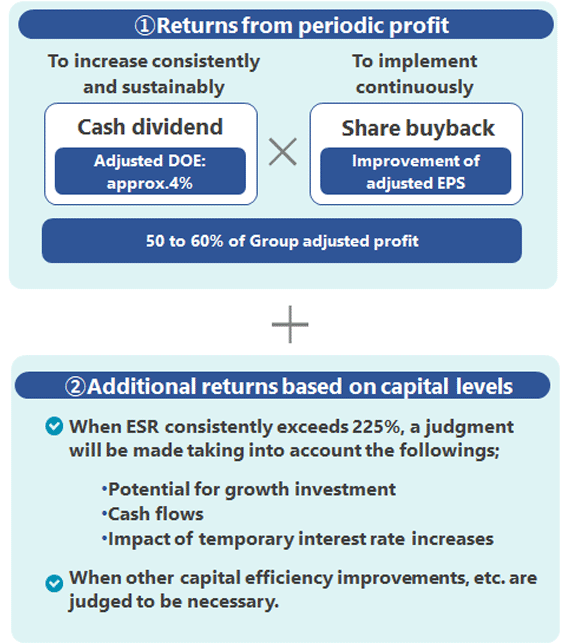
- ・We will pay cash dividends equivalent to approximately 60% of the Group’s average adjusted profit over the most recent five fiscal years.
- ・During the period covered by the Group’s Long-Term Vision (FY2026–FY2030), we aim to achieve a total payout ratio, including acqusition of treasury stock, of approximately 60% over the medium to long term.
Historical Dividends
| Dividend per Share | Total dividend | |||
|---|---|---|---|---|
| Interim | Year-end | Annual(Total) | ||
| FY ended March 31, 2027 | ¥82(Forecast) | ¥82(Forecast) | ¥164(Forecast) | ¥79.1 billion(Forecast) |
| FY ended March 31, 2026 | ¥62 | ¥68 | ¥130 | ¥63.6 billion |
| FY ended March 31, 2025 | ¥40 | ¥40 | ¥80 | ¥41.5 billion |
| FY ended March 31, 2024 | ¥35 | ¥35 | ¥70 | ¥37.4 billion |
| FY ended March 31, 2023 | ¥31 | ¥31 | ¥62 | ¥34.3 billion |
| FY ended March 31, 2022 | ¥28 | ¥28 | ¥56 | ¥32.1 billion |
| FY ended March 31, 2021 | ¥22 | ¥24 | ¥46 | ¥27.4 billion |
| FY ended March 31, 2020 | ¥22 | ¥22 | ¥44 | ¥26.4 billion |
| FY ended March 31, 2019 | ¥20 | ¥22 | ¥42 | ¥25.7 billion |
| FY ended March 31, 2018 | ¥17.5 | ¥20 | ¥37.5 | ¥23.3 billion |
| FY ended March 31, 2017 | ¥15 | ¥17.5 | ¥32.5 | ¥20.5 billion |
| FY ended March 31, 2016 | - | ¥30 | ¥30 | ¥19.4 billion |
| FY ended March 31, 2015 | - | ¥25 | ¥25 | ¥16.6 billion |
| FY ended March 31, 2014 | - | ¥25 | ¥25 | ¥16.8 billion |
| FY ended March 31, 2013 | - | ¥22.5 | ¥22.5 | ¥15.1 billion |
| FY ended March 31, 2012 | - | ¥22.5 | ¥22.5 | ¥15.1 billion |
| FY ended March 31, 2011 | - | ¥45 | ¥45 | ¥15.3 billion |
| FY ended March 31, 2010 | - | ¥45 | ¥45 | ¥15.3 billion |
| FY ended March 31, 2009 | - | ¥45 | ¥45 | ¥12.3 billion |
| FY ended March 31, 2008 | - | ¥65 | ¥65 | ¥16 billion |
| FY ended March 31, 2007 | - | ¥65 | ¥65 | ¥16 billion |
| FY ended March 31, 2006 | - | ¥55 | ¥55 | ¥13.5 billion |
*
T&D Holdings conducted a 2 for 1 stock split on October 1, 2011.
Please see "TANSHIN Reports" page for the projected dividend.
Share Buybacks
| Total amount of acquisition | Acquisition time | |
|---|---|---|
| FY ended March 31, 2026 | About ¥30 billion | From June 2026 to September 2026 (Scheduled) |
| FY ended March 31, 2025 | About ¥100 billion | From May 2025 to March 2026 |
| FY ended March 31, 2024 | About ¥50 billion | From May 2024 to April 2025 |
| FY ended March 31, 2023 | About ¥40 billion | From May 2023 to February 2024 |
| About ¥20 billion | From November 2022 to March 2023 | |
| FY ended March 31, 2022 | About ¥40 billion | From November 2021 to May 2022 |
| FY ended March 31, 2021 | About ¥10 billion | From May to June 2021 |
| FY ended March 31, 2020 | About ¥13 billion | From November to December 2020 |
| FY ended March 31, 2019 | About ¥13 billion | From May to June 2019 |
| FY ended March 31, 2018 | About ¥17 billion | From May to June 2018 |
| FY ended March 31, 2017 | About ¥17 billion | From May to June 2017 |
| FY ended March 31, 2016 | About ¥5 billion | In February 2017 |
| About ¥14 billion | From May to June 2016 | |
| FY ended March 31, 2015 | About ¥30 billion | From May to July 2015 |
| FY ended March 31, 2014 | About ¥10 billion | From May to June 2014 |
| FY ended March 31, 2013 | About ¥3 billion | In May 2013 |
| FY ended March 31, 2012 | About ¥5 billion | From November to December 2011 |
Stockholder Benefit Program
Not Implemented.